CBSE Class 8 Maths Pie Charts
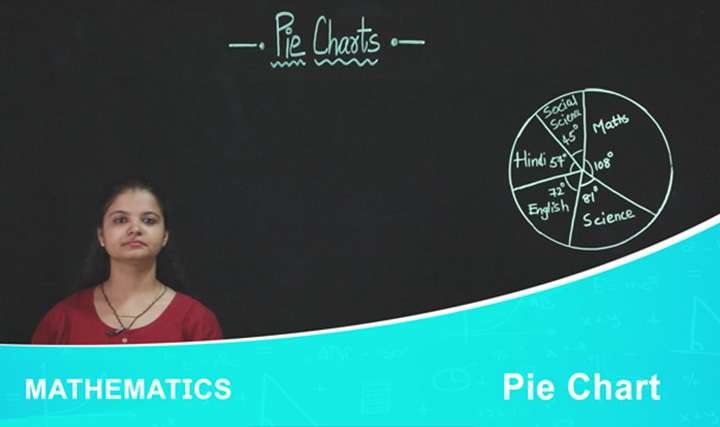
- What is a pie chart ?
- A survey was conducted in a school to determine which sport is liked by the students. The result of the survey is given in the table below. Sport % of students Football 15 Basketball 20 Baseball 10 Tennis 40 Soccer 15 Represent the given data by a pie chart.
-
The local dealerships' vehicle sales were compared and the result is depicted by the following pie chart.
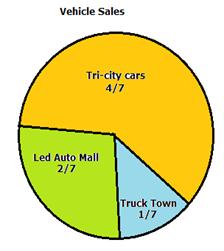 The local dealerships sold a total of 35 vehicles. How many more vehicles were sold by Led Auto Mall than by Truck Town?
- A man with a monthly salary of Rs 10800 plans his budget for a month as given below: Item Food Rent Education Savings Misc Amount 3150 2100 1950 2400 1200 Represent the above data by a pie chart.
-
The following pie-chart shows the percentage distribution of the expenditure incurred in publishing a book. Study the pie-chart and the answer the questions based on it.
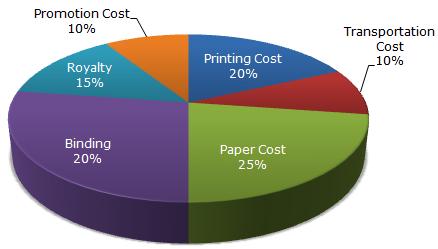 i) If for a certain quantity of books, the publisher has to pay Rs. 30,600 as printing cost, than what will be amount of royalty to be paid for these books?
ii) What is the central angle of the sector corresponding to the expenditure incurred on Royalty?
- The table below shows the grades achieved by 30 pupils in their end-of-year exam. Grade A B C D E Frequency 7 11 6 4 2 Represent above data by a pie chart.
- In a college, there are 750 students in Year 1, 420 students in Year 2 and 630 students in Year 3. Draw a circle graph to represent the numbers of students in the college.
-
A survey was conducted to know the numbers of cars, buses and motorcycles that passes a particular junction. The result is depicted by the given pie chart. There were 150 buses in the survey.
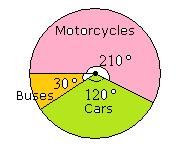 a) What fraction of the vehicles were motorcycles?
b) What percentage of vehicles passing by the junction were cars?
c) Calculate the total number of vehicles in the survey.
d) How many cars were included in the survey?
-
The given pie chart shows the Ankit's family's household expenditure in a month.
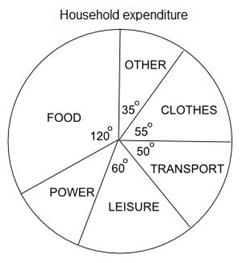 i) If the expenditure on food is Rs 300, what is the expenditure on transport?
ii) What percentage of the family's income is spent on power?
-
The given pie chart shows the amount of time that Samy spends on various activities each day.
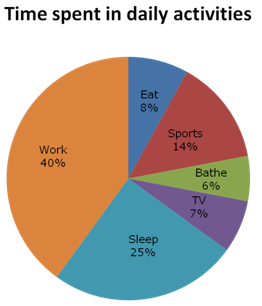 What is the angle for the sector of the pie chart representing the time he spends on sport?

