CBSE Class 8 Maths Bar Graphs and Histograms
- The marks obtained by Kunal in his annual examinations are shown below: Subject Hindi English Mathematics Science Social Studies Marks 63 75 90 72 58 Draw a bar graph to represent above data.
- Draw a histogram for the following data: Class Interval Frequency 0-5 4 5-10 10 10-15 18 15-20 8 20-25 6
-
Use the table below to construct a double bar chart.
- The following table shows the number of visitors to a park for the months January to March. Month January February March No. of Visitors 150 300 250 a) Construct a bar graph representing the given data. b) What is the percentage increase in visitors in March as compared to January? c) What percentage of visitors came in February as compared with total number of visitors over the three months?
- The following data shows the number of adult visitors and child visitors to a park. Construct a double bar graph for the given data. Month April May June Number of adult visitors 300 500 700 Number of child visitors 200 600 600
-
Two dice were tossed 100 times. The total points of each toss are represented in the histogram below:
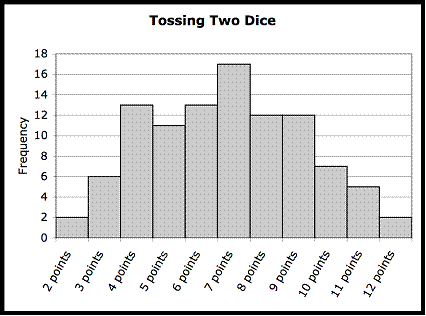 Use the histogram to answer each of the following question.
a. Which outcome happened the most times?
b. How many times did this outcome discussed in part a happen?
c. How many rolls had a total of less than 6 points?
d. How many rolls had a total of 10 or more points?
-
A class carried out an experiment to measure the lengths of cuckoo eggs. The length of each egg was measured to the nearest mm. The results are shown in the following histogram:
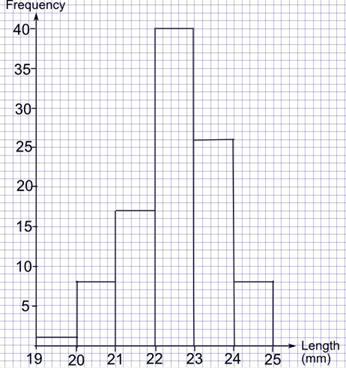 1) How many eggs were measured altogether in the experiment?
2) How many eggs were less than or equal to 23 mm in length?
-
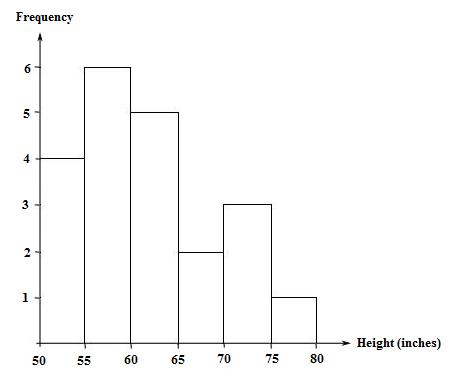 The histogram shows the heights of 21 students in a class. The height of how many students were greater than or equal to 55 inches but less than 70 inches?
-
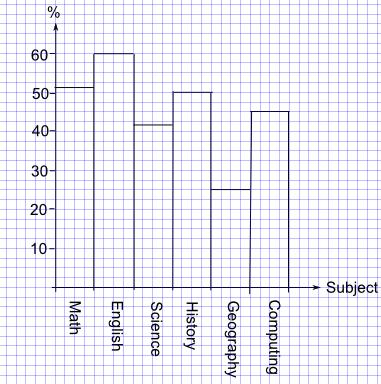 The bar graph shows the marks Brett obtained in his end of year exams. i) How many more percentage points did Brett score in his best subject than in his worst subject?
ii) Brett's friend, Luke, scored 12 percentage points higher than Brett in Science. What was Luke's marks for Science?
-
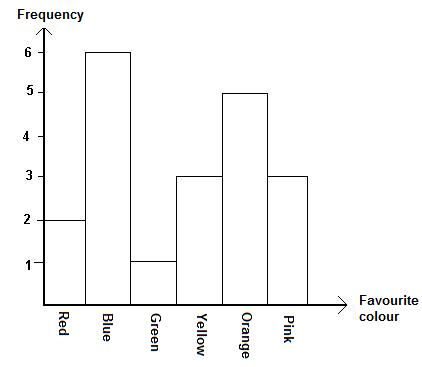 The given bar graph shows the favourite colours of 20 students in a class. How many more students favour orange colour than green?

